What does the Pennsylvania radon map show?
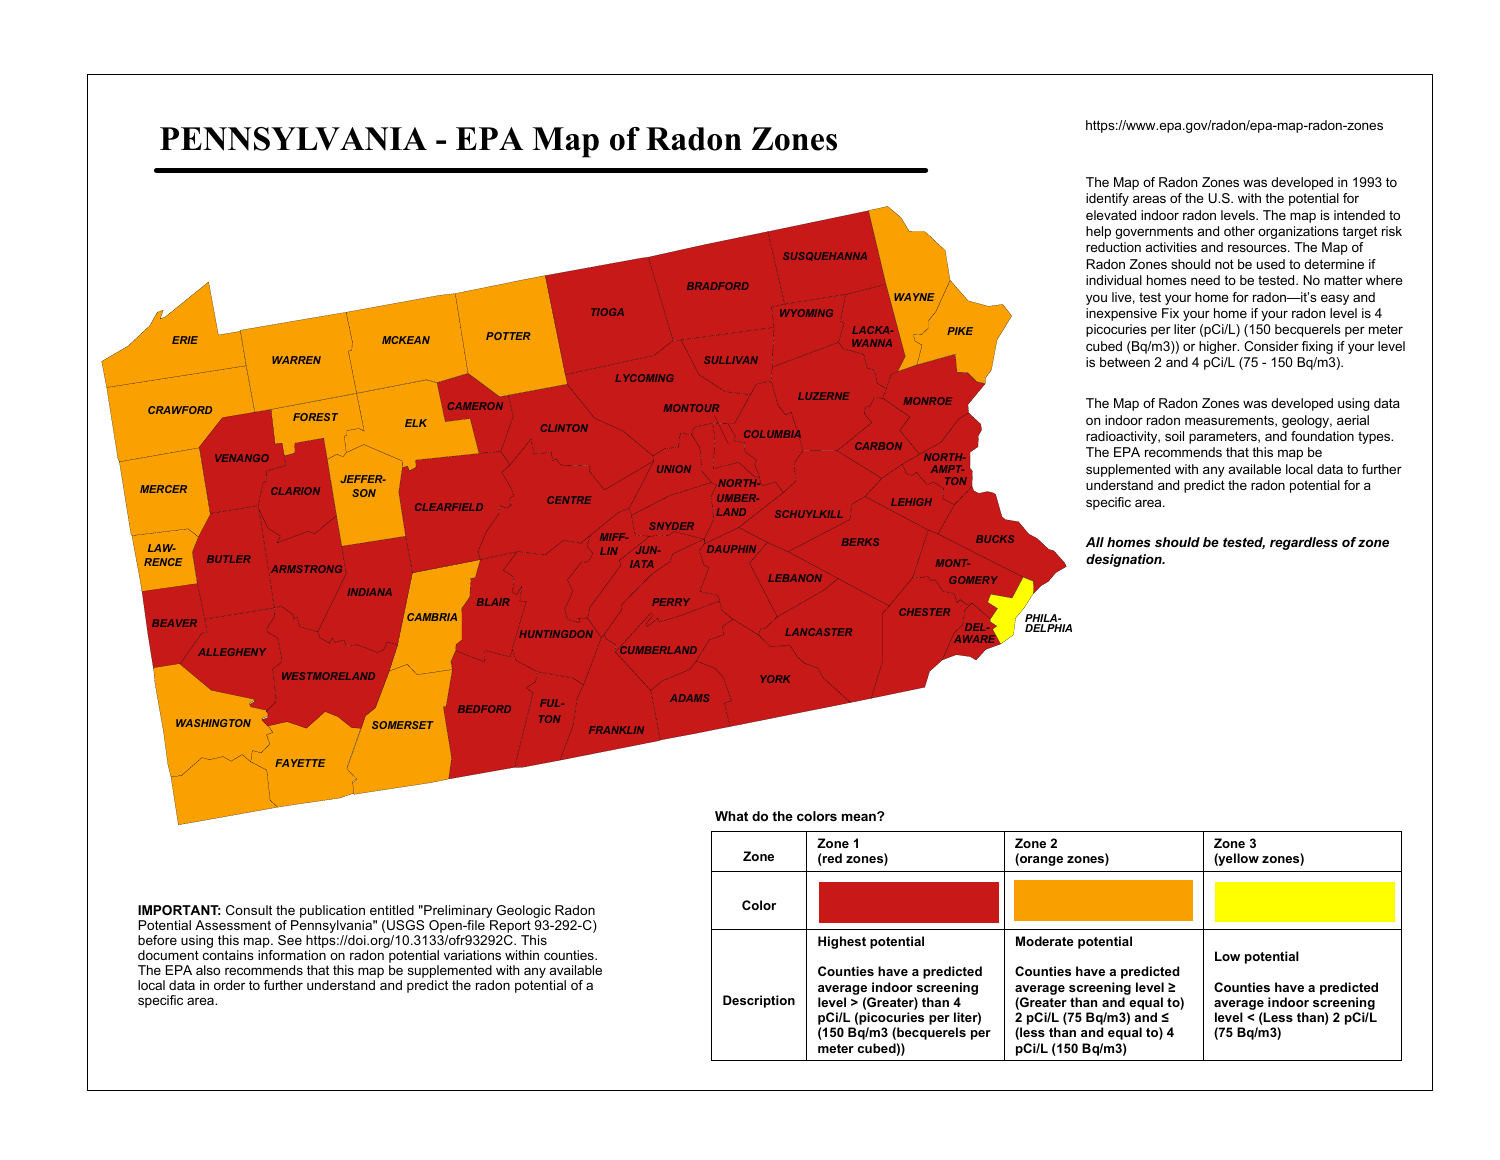
The EPA map shows county-level predicted indoor radon potential. It does not give a current test result for a house, a street or a whole city. The map was developed in 1993 to support planning and should be read alongside available local data.
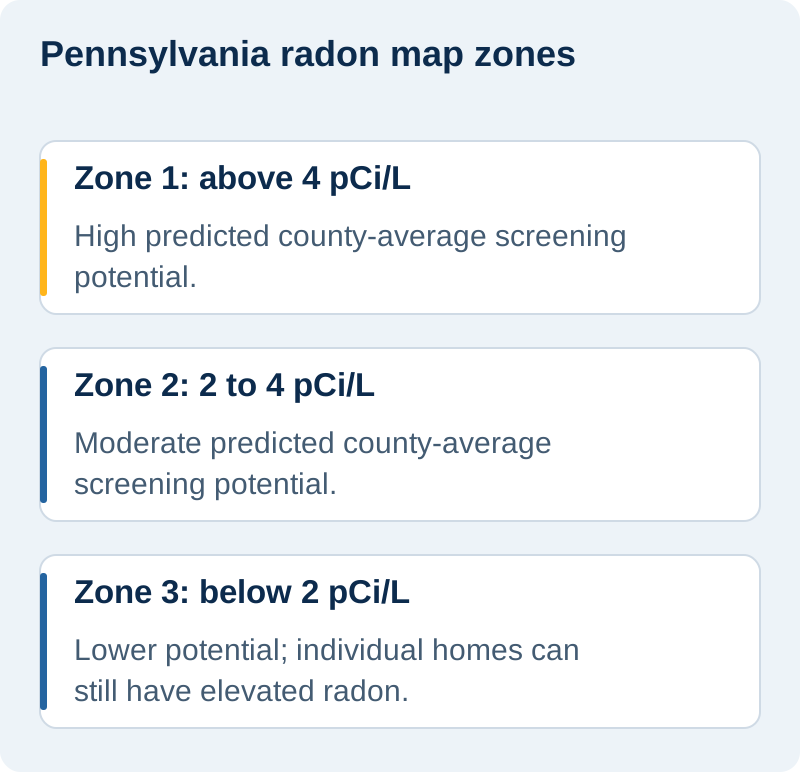
| Zone | Predicted average indoor screening level | What a homeowner should do |
|---|---|---|
| Zone 1 | Above 4 pCi/L | Test the individual property. |
| Zone 2 | 2 to 4 pCi/L | Test the individual property. |
| Zone 3 | Below 2 pCi/L | Test the individual property. |
Source: EPA Pennsylvania county map and legend.
Are Philadelphia and the surrounding counties in the same zone?
No. Philadelphia is shown in Zone 3, while Bucks, Montgomery and Chester are in Zone 1. The county boundary changes the map classification; it does not establish the radon level inside a building on either side of it.
| Area | County | EPA zone |
|---|---|---|
| Lancaster | Lancaster | 1 |
| Pittsburgh | Allegheny | 1 |
| Philadelphia | Philadelphia | 3 |
| Doylestown | Bucks | 1 |
| Harrisburg | Dauphin | 1 |
| State College | Centre | 1 |
Where can I look up radon test results by ZIP code?
PA DEP provides a Radon Test Data by ZIP Code report through its Radiation Protection Reports page. Read the report's own collection period, test types and sample information. Availability can depend on the number of results for the postal area.
Check whether the result describes a basement or first-floor measurement. Read the number of tests and reporting dates alongside the average; different floors and time periods should not be treated as equivalent.
Why is a local average not my home's radon level?
An average combines results from other buildings and measurement conditions. The homes tested may not represent every property in the area. A small set of voluntarily submitted readings is especially limited and should not be presented as a citywide survey.
Read basement and first-floor results separately. A property with a finished basement can have a different exposure pattern from a home where people only use upper floors. Test the level appropriate to the building’s use and the applicable protocol.
What should I use to decide on mitigation?
Use the property's own test results and the applicable follow-up protocol. EPA recommends reduction at 4 pCi/L or higher and consideration of reduction from 2 to below 4 pCi/L.
The testing guide explains the measurement options. If work is needed, local directory pages connect the location to companies with published coverage.
Action level: EPA guidance. Data reviewed September 22, 2026.
Which radon data should you use?
Use a home test for a mitigation decision, a ZIP report for nearby measurements and a county map for broad geographic context. These sources answer different questions and should not be substituted for one another.
| Data source | Geographic detail | Useful interpretation |
|---|---|---|
| EPA zone map | County | Predicted screening potential for planning. |
| PA DEP ZIP report | Postal area and reported samples | Measurements from the reporting dataset; check dates and sample size. |
| Property test | A room or testing location in one building | The evidence used with the testing protocol to decide on mitigation. |
Can an Airthings map replace a radon test?
No. The Airthings map of participating devices cannot establish the concentration inside an untested home. Sensor locations, measurement periods and the homes represented affect the displayed average. Use the map as additional context, then measure the building itself.
Does Zone 3 mean a home is below the action level?
No. Zone 3 means a predicted county-average screening level below 2 pCi/L. Individual homes can still exceed 4 pCi/L. Philadelphia’s classification is therefore a reason to understand the scale of the map, not a reason to skip testing.
Sources reviewed September 22, 2026.